Perfect Water Valve
Smart Valve™ Industry Performance Data

Industry-by-Industry Results

Verified field data organized by sector. Click any industry heading to view the full hub page.

Portfolio-Wide Performance Numbers

≥15%
Guaranteed Minimum
In writing — in your contract
58.69%
Peak Verified Savings
Amazon YYZ3 — independently measured
20%+
Portfolio Average
Across 20+ documented installations
$50K+
Max Annual Savings
Per location, per year (Grand Central Tampa)
The Root Cause of Inflated Water Bills

Phantom Volume — Why You Pay for Air

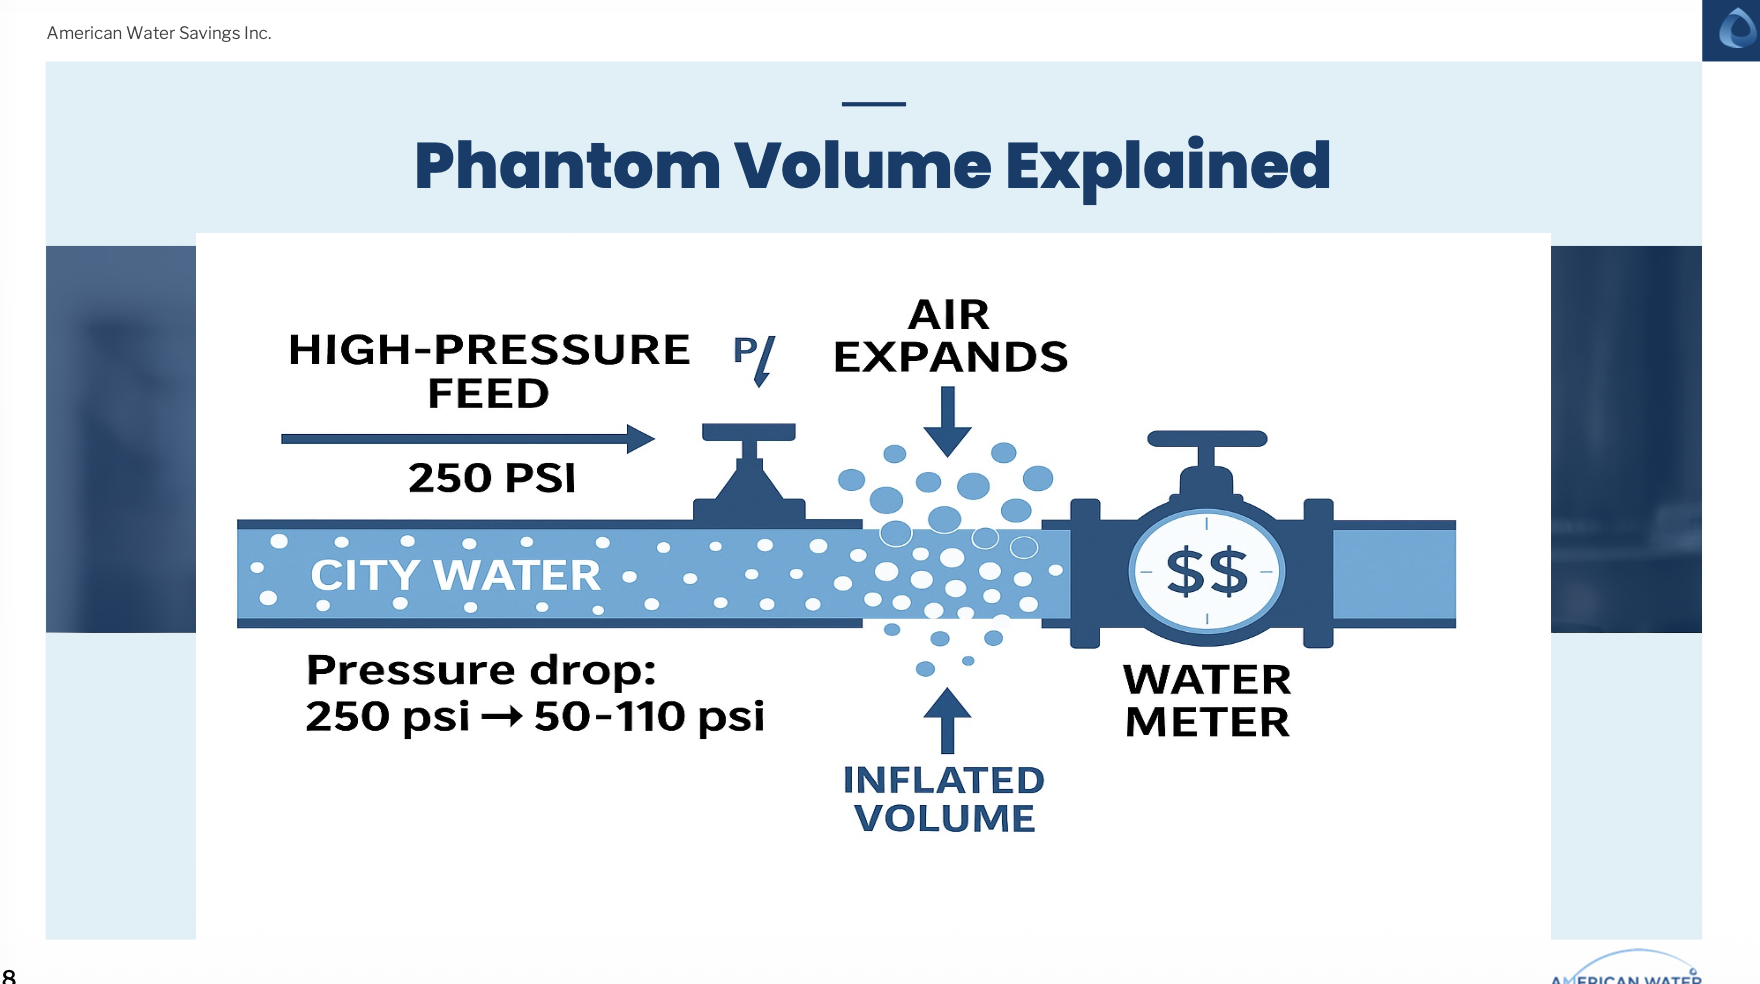
City water travels at ≈250 psi in distribution mains, keeping dissolved air fully compressed. At your building's PRV or pressure regulator, the line drops to 50–110 psi — creating an instant decompression zone. Air expands 4–5× its compressed volume, forming millions of micro-bubbles that displace water yet still spin the turbine or piston inside your meter. You're billed for air as if it were water. Smart Valve™ maintains upstream compression to prevent this.

Phantom Volume diagram showing how air expansion inflates water meter readings
City Main Pressure
≈250 psi
Air stays compressed — fully dissolved in water
Decompression Drop
50–110 psi
At PRV/regulator — air expands 4–5× volume
Meter Inflation
Phantom Volume
Bubbles spin meter without delivering real water
Data Centers

Amazon YYZ3 & YYZ4 · Brampton, Ontario · Installed June 2024 · IPMVP Option B

58.69%
YYZ3 Peak (Q3 2024 YOY)
43.98%
YYZ3 Q3/Q4 2024 Average
29.3%
Portfolio Avg — YYZ3 & YYZ4
2
Independent M&V Methodologies
Quarterly Savings % — YYZ3 vs YYZ4

Blue = YYZ3 · Teal = YYZ4 · Red = below-baseline quarters · Green dashed = ≥15% guarantee

Verified Data Points
Peak reduction35%+ — YYZ3, Q3 2024 (YOY)
YYZ3 Q3/Q4 avg43.98% year-over-year
YYZ4 Q3/Q4 avg14.6% (Q4 impacted by valve removal)
M&V standardIPMVP Option B (Retrofit Isolation)
Monitoring periodQ3 2024 & Q4 2024 (year-over-year)
YYZ4 Q4 noteValve removed Sept 5, reinstalled Oct 25
PDF availableYes — formal report on request
Data Centers hub page
Hotels & Hospitality

Four Seasons Fort Lauderdale · St. Regis Toronto · Marriott-approved installation

26%
Four Seasons Daily Avg
56%
Four Seasons Oct Peak
$49,889
St. Regis Annual (CAD)
20%+
St. Regis Reduction
Reduction % — Four Seasons Ft Lauderdale & St. Regis Toronto

Four Seasons: third-party M&V Dec 2025 · St. Regis: chief engineer confirmed

Verified Data Points
Four Seasons avg26% daily reduction
Four Seasons peak56% (October 2025)
Four Seasons savings~$27,000/yr (USD)
St. Regis annual$49,889 CAD saved
St. Regis reduction20%+ YOY
Installation timeUnder 1 hour (Marriott-approved)
Hotels & Hospitality hub
Multifamily

Grand Central Tampa · Houstonian Estates · Toronto Multi-Residential Portfolio · IPMVP Option B

$50K/yr
Grand Central Tampa
15–31%
Toronto Portfolio Range
31%
1121 Steeles Ave Peak
p<0.01
Statistical Significance
Savings % by Property

Grand Central & Houstonian: self-reported GM testimonials · Toronto Portfolio: IPMVP Option B, 95% confidence

Verified Data Points
Grand Central Tampa23% avg · $50K/yr · 2 yrs
Houstonian Estates16% · 6,000 gal/day saved
1121 Steeles Ave (TO)31% avg · 6 months · IPMVP
797 Don Mills Rd (TO)18% avg · 5 months · IPMVP
21 & 23 Carlton St (TO)15%+ trend reversal · IPMVP
M&V methodologyIPMVP Option B · 95% confidence
Multifamily hub
Car Washes

Caliber Car Wash — 5 sites in Georgia & Florida · Independent M&V · 3+ quarters

23%
Weighted Average (5 sites)
5
Independently Verified Sites
>20%
Minimum at Any Single Site
Savings % per Site — Caliber Car Wash Portfolio

Independent M&V at each location · Georgia (Sites 1–2) · Florida (Sites 3–5)

Verified Data Points
Weighted avg23% across all 5 sites
Monitoring period3+ consecutive quarters
Range21%–24% (no site below 20%)
Site geography2 Georgia · 3 Florida
Secondary benefitHard water scale reduction at all sites
M&V PDFAvailable on request
Car Washes hub
Hospitals & Healthcare

RWJ Barnabas Ambulatory Care · Livingston, NJ · Installed December 2016 · NSF 61 & 372

$15,500
Annual Cost Savings
19%
Total Metered Reduction
1.53M
Gallons Saved Per Year
<6 mo
Simple Payback Period
Annual Water Cost — Before vs After (RWJ Barnabas)

$72,700 → $57,200 per year · Confirmed by Facility Engineer J. Flanagan

Verified Data Points
Annual cost before$72,700
Annual cost after$57,200 (-$15,500)
Volume reduction19% metered
Gallons saved1,533,000 per year
Payback periodUnder 6 months
CertificationsNSF 61 · NSF 372 (drinking water safe)
ComplianceASHRAE 188/514 · Joint Commission ready
Hospitals & Healthcare hub

Cross-Industry Portfolio

Average Savings by Industry (%)

Average independently verified savings rates across all documented Smart Valve™ installations.

Figures represent verified averages across documented installations · ≥15% is the contractual floor for all installations

Get a Site-Specific Proposal

ROI calculator + projected savings by facility type. No commitment required.

Smart Valve™ Technical Overview

Smart Valve™ is a patented passive mechanical device installed at the main commercial water supply line on the customer side of the water meter. It requires no electricity, no ongoing maintenance, and no operational changes from building management or tenants. The device works by creating a controlled hydrostatic back pressure zone upstream of the meter, preventing the rapid air expansion that occurs when high-pressure municipal supply water drops to building operating pressure. The result is that the water meter registers only actual liquid water volume — not the inflated mix of water and air that typically inflates commercial water bills by 15 to 40 percent.

Installation requires a single water supply shutdown lasting up to 3.5 hours — the only interruption in the device's lifetime. Following installation, a licensed AWS technician returns at the four-week mark to calibrate the valve to your building's specific pressure profile. Quarterly measurement-and-verification reports, produced by independent engineers, confirm ongoing savings and provide documentation for utility rebate applications. Smart Valve™ carries NSF/ANSI/CAN 61 (drinking water system components) and NSF/ANSI 372 (lead-free compliance) certifications and a 10-year manufacturer warranty covering full parts, service, and replacement.

Smart Valve™ is compatible with 99 percent of commercial water meters and is available in pipe sizes from 0.75 inches through 12 inches, covering the full range of commercial, industrial, and multifamily applications. Perfect Water Valve provides a written savings guarantee before any installation begins. Facilities that do not achieve the guaranteed minimum savings within the first six months have the right to full removal at no cost and a refund of all program fees paid during the trial period.

The measurement-and-verification process used to confirm Smart Valve™ savings follows IPMVP (International Performance Measurement and Verification Protocol) Option B methodology, which involves metering at the point of installation and comparing measured consumption against a pre-installation baseline adjusted for occupancy and weather variables. This is the same M&V methodology accepted by utility rebate programs, government energy and water efficiency grant programs, and commercial real estate sustainability certifications including LEED, ENERGY STAR, and BREEAM. All M&V reports are produced by third-party licensed engineers with no financial relationship to Perfect Water Valve or its distribution partners.

Smart Valve™ has received regulatory approval and NSF certification through IAPMO Research and Testing, Inc., one of the most widely recognized accredited testing laboratories for plumbing products in North America. IAPMO certification is accepted by building inspectors, health departments, and water utilities across all 50 US states and Canadian provinces. Property managers and facility directors can present the NSF certification documentation to any regulator or insurer requiring verification of water system component compliance for potable water applications.