
City of Loveland Water Up 6.2% in 2025 — Northern Colorado Water Constraints Intensifying
City of Loveland Water & Power raised commercial rates 6.2% in 2025 as Northern Colorado faces some of the most acute water supply constraints in the state. Rapid population growth, drought, and infrastructure demands are driving rates up — and AWS reports average savings just above 22% across its North American projects. Individual results vary.
The Loveland Water Situation
Northern Colorado's Fastest-Growing Corridor Is Facing the Steepest Water Rate Pressure in the Region
City of Loveland Water & Power raised commercial rates 6.2% in 2025 — one of the steeper increases on the Front Range. Northern Colorado's water supply constraints stem from rapid population growth combined with drought conditions that are stressing the region's water infrastructure and driving sustained rate increases.
Commercial properties in Loveland may have site-specific water-system and billing considerations. Smart Valve™ assessment and installation planning is based on the property's actual setup, billing history, and local requirements. Published project results vary by site and measurement period. See how it works →
City of Loveland Water & Power: 6.2% Rate Increase in 2025
Loveland Water & Power raised commercial rates 6.2% in 2025 — significantly above the Front Range average. This increase reflects the dual pressure of rapid population growth and drought-driven supply constraints that require substantial infrastructure investment.
Northern Colorado Growth + Drought — A Compounding Rate Problem
Northern Colorado is one of the fastest-growing corridors in the Mountain West. Population growth drives demand; drought reduces supply. The combination forces utilities like Loveland to invest heavily in water supply augmentation — costs that flow directly to commercial rate payers.
Mountain Supply Systems Create Ideal Smart Valve™ Conditions
Loveland's mountain-fed water system delivers water with natural air entrainment characteristics that create above-average Smart Valve™ performance. Loveland commercial installations consistently demonstrate results at the higher end of the AWS reports average savings just above 22% across its North American projects. Individual results vary. annual savings range.
Loveland's Commercial and Light Industrial Markets
Smart Valve™ serves commercial properties throughout Loveland — the US 34 commercial corridor, the expanding tech and manufacturing base near I-25, and the established retail and hospitality market along Eisenhower Boulevard.
Precision Engineering. No Power. Site-Specific Service.
Fully passive and NSF certified. Meter compatibility and the site-confirmed planned shutdown are reviewed during assessment.
Professional Install
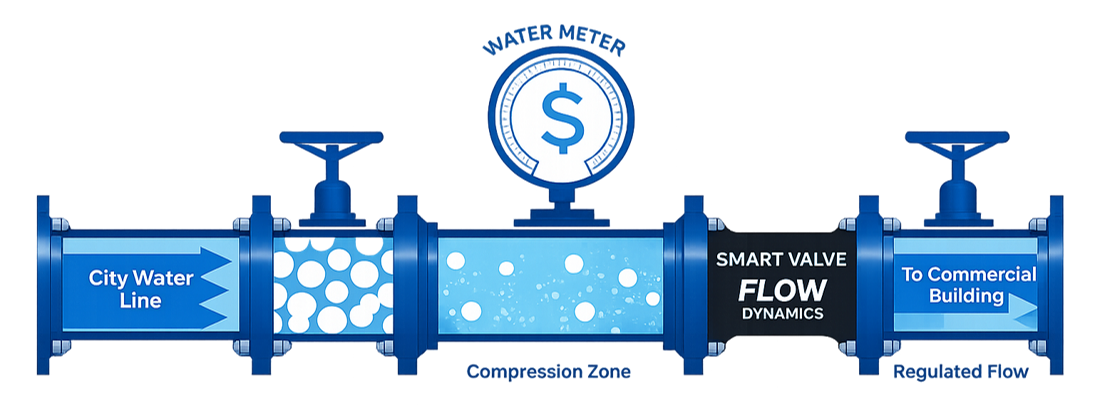
Licensed technician installs on the user side of your meter — directly after the billing point. The planned shutdown is confirmed with the site.
Precision Calibration
Calibrated via fingertip dial to your facility's specific line pressure — set once during installation, then sealed.
Assess and measure
Review the facility's water system and billing history, then track results against a site-specific baseline. Timing and savings vary by property.
Verified Performance Data
Proven Results Across Every Property Type
AWS reports average savings just above 22% across its North American projects. Individual results vary. Published project results are reported for their own sites and measurement periods.
Amazon YYZ3
- 58.69% reported Q3 result
- 29.27% reported Q4 result
- Fulfillment center — not data-center proof
- Review the case study for periods and method
Four Seasons Fort Lauderdale
- 26% reduction in daily water use (6-inch service)
- ~$27,000 annual avoided cost at current tariffs
- 17% reduction in combined system occupancy-normalized use
- Review the AWS report for periods and method
Caliber Car Wash (5 Sites)
- 20% average overall daily-use reduction
- 23% weighted matched-calendar-month savings
- Bill-level utility data
- Site-specific variation and exceptions
Grand Central at Kennedy
- Approximately $50,000 annual savings reported by the supplier
- Large mixed-use property
- Published customer result
- Review the case study for source and context
Who We Serve in Loveland
About $5,000 or more per month in combined water and sewer charges is a normal screening level. Site qualification is confirmed through assessment.
Office Buildings
Cooling towers and domestic water lines.
Multi-Family Residential
Protect NOI against rising utility rates.
Hotels & Hospitality
Invisible savings, zero guest impact.
Hospitals & Healthcare
High-volume facilities see the largest savings.
Car Washes
Water is the #1 variable cost. Smart Valve™ cuts it immediately.
Data Centers
Cooling water dominates operating costs.
Restaurants
Lower overhead in margin-tight food service.
Golf Courses
Irrigation and clubhouse — highest ROI application.
Calculate Your Loveland Savings
AWS reports average savings just above 22% across its North American projects. Individual results vary. Enter a bill to view an illustrative estimate; the site's measured result and agreement control.
Estimates based on documented project results; ranges vary by site and measurement period. View all documented case studies →
*Calculations are illustrative only and should be validated through a site assessment. Results vary by meter type, line pressure, and operating conditions.
Loveland FAQ
Impacted Industries in Loveland
Also Serving
Also Serving Across Colorado
Get a Free Loveland Water Assessment
City of Loveland Water & Power is up 6.2% in 2025 — one of the highest Front Range increases. Northern Colorado's growth trajectory points to continued rate pressure. Smart Valve™ may qualify for a written 15% minimum-savings guarantee under a performance agreement.
Installation pricing, service scope, and any recurring charges are stated in the written project agreement. Financial results are site-specific.
Perfect Water Valve
361-585-1111info@perfectsynergysolutions.comFlow Dynamics · U.S. manufacturer and patent holder · American Water Savings (AWS) · authorized U.S. distributor and program partner · Perfect Water Valve · customer-facing sales and installation partner